Service E · continued
Comparing options on whole-life cost
15
01
Define the study period
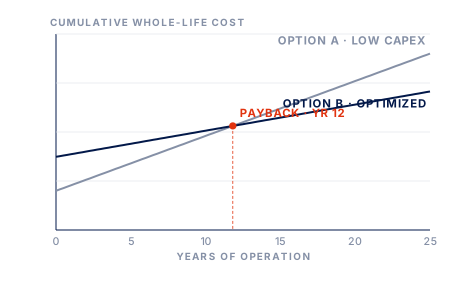
Set against the client's holding period or the asset's design life, not a default. The period chosen determines which option wins.
02
Model the cash flows
Capital, energy, water, maintenance, periodic replacement and disposal, with energy demand taken from the building energy model rather than assumed.
03
Discount to present value
Apply the client's discount rate and escalation assumptions, and state them explicitly. The result is only meaningful alongside them.
04
Test the sensitivity
Vary energy tariff, discount rate and component life. An option that only wins under one set of assumptions is not a recommendation.
Typical questions we answer
- Which façade specification gives the best whole-life return?
- Does the higher-efficiency chiller plant pay back within the holding period?
- What is the true cost of the value-engineered alternative?
- Should the PV array be sized to demand or to roof area?
- Which package delivers the certification target at lowest whole-life cost?
Deliverables
- Life cycle cost model
- Option comparison & NPV summary
- Payback and discounted cash flow analysis
- Sensitivity and scenario report
- Recommendation with stated assumptions
The analysis exists to show what a proposed capital saving costs across the life of the asset.