Corporate Portfolio

Sustainability.
Innovation.
Intelligence.

Sustainability certification, ESG, carbon accounting and advanced building-performance analysis, integrated into a single technical practice.

Certify
Measure
Optimize
Decarbonize
About OKELIS

A sustainability practice
built on Estidama
delivery.

02

OKELIS is a sustainability and building-performance consultancy working across the built environment in Abu Dhabi and the wider GCC.

Our team holds Pearl Qualified Professional and Independent Commissioning Agent appointments and has delivered 25 projects under the Abu Dhabi Estidama Pearl Rating System, across schools, mosques, hospitals, villas, commercial towers, residential buildings and a hyperscale data centre.

Alongside certification we run the technical analysis that supports it: whole-building energy modelling to ASHRAE 90.1 Appendix G, daylight simulation, life cycle assessment to EN 15978, life cycle costing to ISO 15686-5, construction waste management and greenhouse gas accounting to the GHG Protocol.

Every recommendation is quantified. Where a target is set we model it, measure it and report against it, using recognised standards and established simulation tools, and we document the assumptions so the result can be checked by a third party.
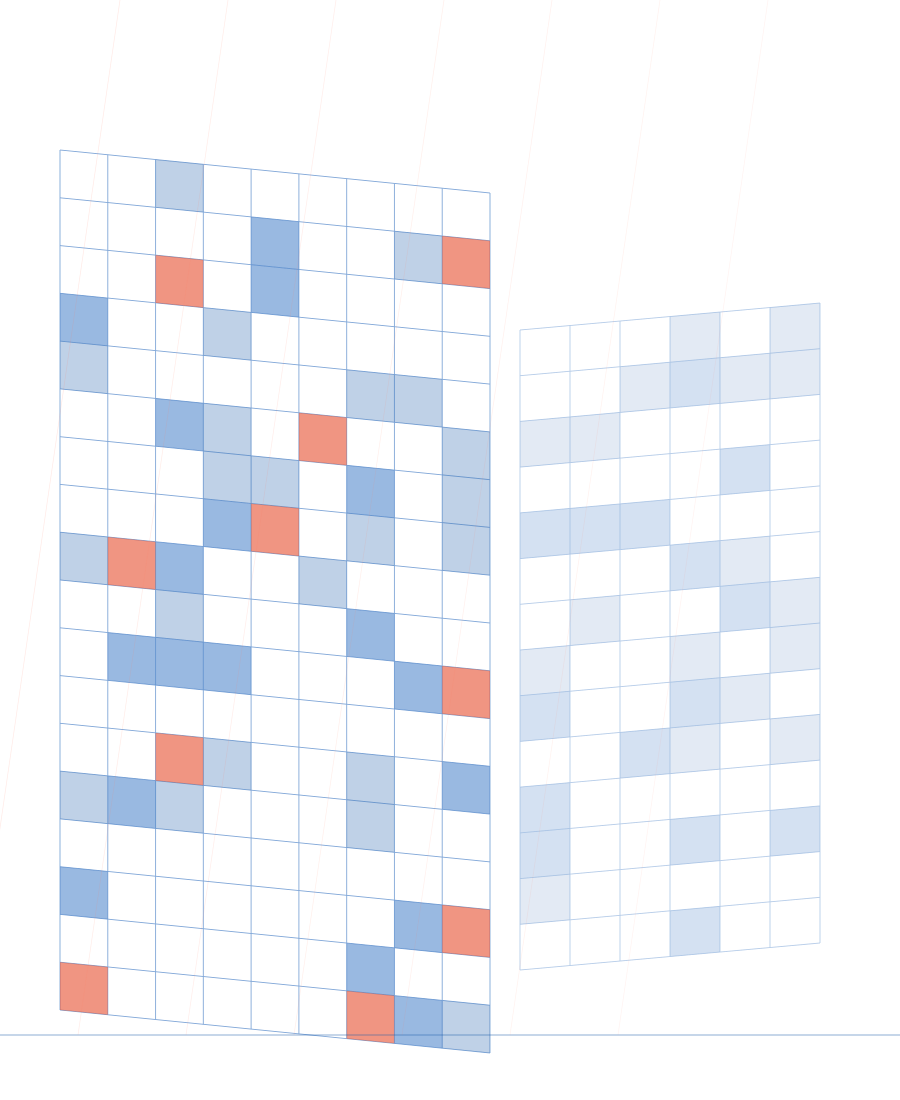
Fig. 02.1 · Indicative imagery. To be replaced with OKELIS project photography
OKELIS integrates sustainability certification, ESG, carbon accounting and advanced building-performance analysis to help organizations and project teams make better decisions, reduce environmental impact and deliver high-performing, resilient buildings.
25
Projects delivered under Estidama
PQP
Pearl Qualified Professional
ICA
Independent Commissioning Agent
2 Pearl
Highest Estidama rating delivered
OKELIS Corporate Portfolio 02
Purpose · Vision · Mission

Why we exist,
and what we are
building toward.

03
01 Purpose
Better decisions,
earlier

Most of a building's environmental and financial performance is fixed by decisions taken in the first ten percent of a project. We exist to put reliable evidence in front of those decisions while they can still be changed.

02 Vision
Performance as
the standard

To be the regional consultancy of reference for evidence-based sustainability, where a rating, a target or a disclosure is supported by analysis a third party can reproduce.

03 Mission
Integrate,
quantify, deliver

To integrate certification, carbon, ESG and building-performance analysis into one technical service, so that clients receive a single, coherent and defensible picture of performance.

We are accountable for numbers, not intentions.

Energy use intensity in kWh/m²/yr. Tonnes of CO₂e by scope. Spatial daylight autonomy as a percentage of floor area. Net present cost over a defined study period. Pearl credits awarded. Each is modelled against a stated baseline and reported with its assumptions attached.

Our values
Technical rigour

Modelled, referenced and auditable. No unsupported claims.

Independence

Advice driven by the analysis, not by a product or supplier.

Clarity

Complex analysis communicated so decision-makers can act on it.

Accountability

We stay on the project through to certification and operation.

Vision & Mission 03
Why OKELIS

Certification and the
analysis that supports it,
from one team.

04
01
Integrated by default

Energy, daylight, carbon, cost and certification are run by the same team on the same model. Findings from one discipline immediately inform the others, with no re-basing and no contradictory reports.

02
Evidence, not assertion

Every target is backed by simulation or measured data, prepared against recognized standards and structured so it survives third-party review by a certification body, auditor or lender.

03
Parametric option testing

We use parametric simulation and AI-assisted workflows to evaluate large option sets within the design programme, so that envelope, glazing and plant selections are ranked on modelled results rather than on precedent.

04
Estidama specialists

Pearl Qualified Professionals with 25 Estidama projects delivered under PBRS and PVRS, working daily with the Abu Dhabi review process, alongside Al Sa'fat, Barjeel, Mostadam, LEED, BREEAM and WELL.

05
Whole-life view

We assess environmental impact and financial impact together, so the specification that wins is the one that performs across the asset's life, not simply the one with the lowest capital cost.

06
Through to handover

We remain engaged through construction-stage compliance, contractor coordination, submission and final award. This is the stage at which certifications are most often lost.

Client value
De-risked approvals, lower operating cost, and a defensible sustainability position with regulators, investors and occupiers.
Design
Options tested before they are costed
Approval
Submissions built to reviewer expectations
Operation
Performance tracked against the model
Why OKELIS 04
The OKELIS Sustainability Ecosystem

How the disciplines
connect.

05

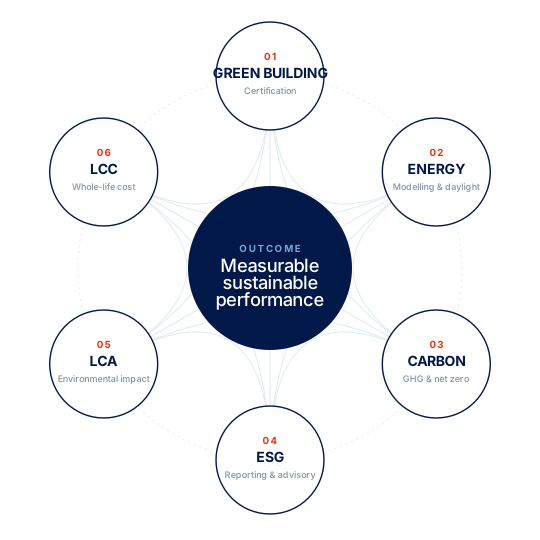
Buildings and organizations are not certified, measured, costed and decarbonized in isolation. Each analysis constrains and improves the others. OKELIS runs them as one connected system, so that a change in the façade specification is immediately visible in the energy model, the carbon inventory, the whole-life cost and the certification score.

Certify

LEED · BREEAM · Estidama · WELL · Mostadam · Barjeel · Al Sa'fat

Measure

Energy · Daylight · GHG inventories · ESG data · Baselines

Optimize

Simulation · ECM evaluation · LCA · LCC · Scenario testing

Decarbonize

Reduction strategy · Net-zero pathway · ESG strategy · Reporting

Certify
Measure
Optimize
Decarbonize
Sustainability Ecosystem 05
A
Service A
Green Building & Sustainability Certification

Certification,
managed from
concept to award.

06

We take responsibility for the certification outcome, not only for the documentation.

Certification fails at the seams: a credit assumed at concept that the specification cannot support, a construction-stage record nobody collected, a submission built to the wrong reviewer expectation. OKELIS manages the whole path: feasibility, target setting, design-stage compliance, contractor coordination, submission and award.

We advise on the rating system that genuinely suits the asset, its jurisdiction and its commercial objective, then run the credit strategy against the design as it actually develops.

Rating systems
LEEDBREEAM Estidama · PearlWELL Mostadam · KSABarjeel · RAK Al Sa'fat · DubaiDubai Green Building Regs
Scope of service
  • Rating-system selection
  • Credit feasibility assessment
  • Sustainability target setting
  • Design-stage compliance management
  • Sustainability design reviews
  • Sustainability workshops
  • Certification documentation
  • Submission & review response
  • Construction-stage management
  • Contractor & consultant coordination
  • Sustainability audits
  • Compliance reviews
Certification lifecycle
1
Concept
Rating selection, credit feasibility, target rating and cost implication.
2
Design
Credit strategy, design reviews, simulation evidence, documentation.
3
Construction
Contractor coordination, submittal review, site records and audits.
4
Certification
Submission, review response, clarification and final award.
5
Operation
Performance verification, recertification and operational reporting.
Certify
Measure
Optimize
Decarbonize
A · Green Building Certification 06
Service A · continued

How we protect the rating

07
01
Feasibility before commitment

We test the target rating against the brief, budget and site before it is written into the contract, so that the project does not commit to a level it cannot reach, or settle for one it could have exceeded.

02
A live credit register

Every credit carries an owner, an evidence requirement and a status. The register is reviewed at each design stage, so nothing is discovered missing at submission.

03
Simulation as evidence

Energy, daylight and water credits are supported by our own models, produced in-house and consistent with the analysis used elsewhere on the project.

04
Construction-stage discipline

Material submittals, procurement records and site practices are reviewed against credit requirements while they can still be corrected.

Deliverables
  • Credit feasibility & gap report
  • Target rating strategy
  • Credit responsibility matrix
  • Design-stage compliance reports
  • Certification documentation set
  • Submission & review responses
  • Construction-stage audit reports
  • Final certification package
Typical engagement
Asset typesCommercial, residential, hospitality, education, healthcare, mixed-use
Entry pointConcept design. Earlier engagement lowers the cost of compliance
DurationDesign stage through final award
InterfacesArchitect, MEP, structural, cost consultant, main contractor
Evidence baseIn-house energy, daylight and water modelling
Note on marks

Certification body logos are shown subject to review and approval under each organization's trademark and usage requirements prior to publication.

Where each rating system applies
LEED

USGBC · International. The default for investor- and tenant-facing commercial assets.

BREEAM

BRE · International. Widely recognized by European investors and funds.

Estidama · Pearl

Abu Dhabi. Mandatory minimum ratings apply to most development.

Al Sa'fat

Dubai. Green Building Regulations compliance for new buildings.

Barjeel

Ras Al Khaimah. Emirate-level green building regulatory system.

Mostadam

Saudi Arabia. National rating system for buildings and communities.

WELL

IWBI · International. Occupant health, comfort and indoor environment.

Selection advice

We advise on the system that meets both regulatory duty and commercial intent.

A · Green Building Certification 07
B
Service B
ESG Reporting & Sustainability Advisory

Reporting that withstands
assurance.

08

ESG performance is only credible when the data behind it can be traced, replicated and audited.

We help organizations move from ad-hoc disclosure to a managed ESG function: a defined reporting boundary, a data architecture that produces the same answer twice, material topics chosen by evidence rather than convention, and KPIs that a board can actually steer by.

Reporting is prepared against recognized frameworks: GRI, TCFD, CDP and the UN Sustainable Development Goals, and structured so that assurance, investor due diligence and lender review can be satisfied without rebuilding the dataset.

Scope of service
  • ESG strategy & advisory
  • Sustainability reporting
  • ESG data collection & management
  • Materiality assessments
  • ESG KPI development
  • ESG gap assessments
  • Environmental performance reporting
  • Decarbonization strategy support
  • Sustainability policies & frameworks
  • Stakeholder & performance analysis
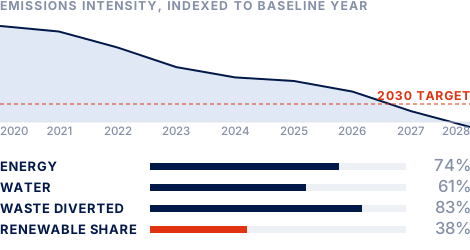
Fig. 08.1 · Indicative ESG performance dashboard. Emissions intensity trend against a 2030 target, with operational KPIs. Illustrative data.
E
Environmental

Energy, emissions, water, waste, materials, biodiversity and climate risk, measured at asset and portfolio level.

S
Social

Health and safety, workforce, occupant wellbeing, supply chain practice and community impact.

G
Governance

Policy, oversight, disclosure controls, data assurance and accountability for stated targets.

Certify
Measure
Optimize
Decarbonize
B · ESG Reporting & Advisory 08
Service B · continued

From disclosure to management

09
Our ESG methodology
1
Scope
Reporting boundary, organizational and operational control, consolidation approach.
2
Materiality
Stakeholder engagement and impact assessment to determine what genuinely matters.
3
Data
Source mapping, collection protocol, quality control and internal assurance trail.
4
Targets
KPI definition, baselines, science-aligned targets and reduction pathways.
5
Report
Framework-aligned disclosure, assurance readiness and stakeholder communication.
Reporting frameworks
GRI Global Reporting Initiative. The most widely adopted standard for multi-stakeholder sustainability reporting.
TCFD Climate-related financial disclosure. Governance, strategy, risk management, metrics and targets. Increasingly expected by lenders.
CDP Environmental disclosure platform. Climate, water and forests questionnaires scored and published to investors.
UN SDGs Sustainable Development Goals. Mapping of organizational contribution against the seventeen global goals.
ISO 14064 GHG quantification and reporting. The verification-grade basis for the emissions figures behind ESG disclosure.
The common failure
Most ESG reports cannot be reproduced twelve months later.

Data is gathered manually, assumptions go unrecorded and the boundary shifts between cycles. The result is a report that cannot be assured, cannot be compared year on year, and cannot support a target.

We build the data architecture first. The report is then an output of the system, not an annual reconstruction.

Deliverables
  • Materiality assessment report
  • ESG data management protocol
  • KPI framework & baseline register
  • Annual sustainability / ESG report
  • Gap assessment against target framework
  • ESG policy and governance documentation
  • Decarbonization strategy input
B · ESG Reporting & Advisory 09
C
Service C
GHG Emissions & Carbon Accounting

Emissions accounted
across all three scopes.

10

A net-zero commitment is only as sound as the inventory underneath it.

We quantify greenhouse gas emissions for organizations, projects and assets across all three scopes, using recognized methodologies and documented emission factors, so that the baseline withstands scrutiny and the reduction pathway is built on something real.

For buildings we assess both operational carbon, the emissions of running the asset, and embodied carbon, the emissions locked into its materials and construction. Both are needed before a credible reduction strategy can be set.

Scope of service
  • Corporate GHG inventories
  • Scope 1 direct emissions
  • Scope 2 purchased energy
  • Scope 3 value chain
  • Project carbon footprinting
  • Operational carbon assessment
  • Embodied carbon assessment
  • Carbon baseline development
  • Emission factor management
  • Carbon reduction strategies
  • Net-zero pathway support
  • GHG reporting & verification support
Methodologies
GHG ProtocolISO 14064 PAS 2060IPCC factors RICS WLCA
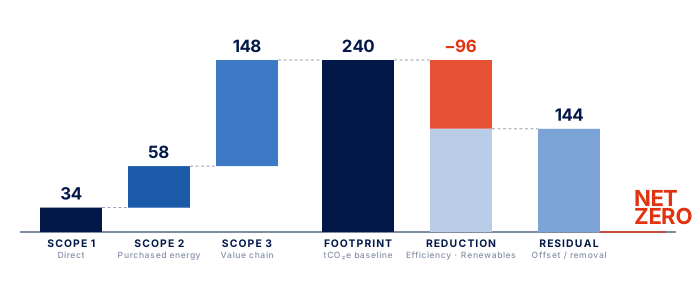
Fig. 10.1 · Scope 1 + 2 + 3 → corporate footprint → reduction → residual → net zero. Illustrative tCO₂e.
Certify
Measure
Optimize
Decarbonize
C · GHG & Carbon Accounting 10
Service C · continued

Three scopes, one inventory

11
SCOPE 1
Direct emissions

Emissions from sources the organization owns or controls: fuel combustion in boilers, generators and chillers, company vehicles, and refrigerant losses from HVAC systems.

Typically the smallest share for a property portfolio, but the most directly controllable.

SCOPE 2
Purchased energy

Indirect emissions from purchased electricity, district cooling, steam and heat. Reported on both a location-based and a market-based method where the data supports it.

The primary lever for most buildings, addressed through efficiency and renewable procurement.

SCOPE 3
Value chain

All other indirect emissions across fifteen categories: purchased goods and services, capital goods, construction materials, business travel, commuting, waste, tenant energy and end-of-life.

Usually the largest and least understood share. Screening establishes which categories are material.

Reduction hierarchy
1
Avoid
Eliminate demand through brief, massing and operational change.
2
Reduce
Efficiency in envelope, systems, controls and materials.
3
Substitute
Lower-carbon energy, materials and suppliers.
4
Offset
High-integrity removal for residual emissions only.
Deliverables
  • GHG inventory report (Scope 1, 2, 3)
  • Emission factor register & assumptions log
  • Baseline year definition
  • Scope 3 screening & materiality
  • Carbon reduction strategy
  • Net-zero pathway & interim targets
  • Marginal abatement cost review
  • Verification support documentation
Why the baseline matters

Every target, every claim and every year-on-year comparison is measured against the baseline. If the boundary is wrong, the factors are undocumented or the data is unverifiable, the whole pathway is unusable, and the correction is visible to everyone who read the first report.

We set the baseline to withstand third-party verification from the outset, and document the recalculation policy for when the organization changes shape.

Scope 3
Commonly 70–90% of a real estate organization's footprint
C · GHG & Carbon Accounting 11
D
Service D
Life Cycle Assessment & EPD

Embodied carbon,
quantified to EN 15978.

12

As operational energy improves, embodied carbon becomes the larger share of a building's lifetime impact.

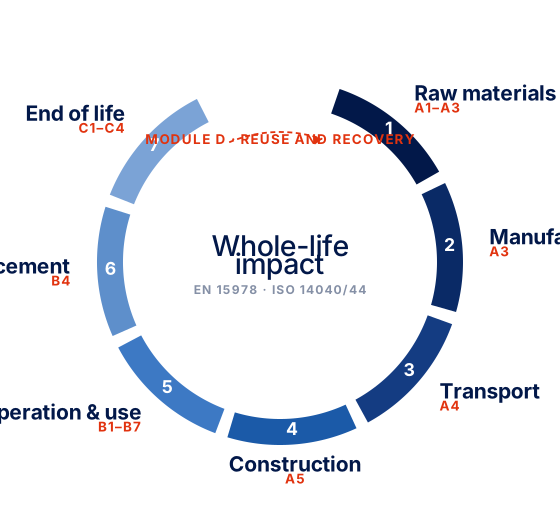
Life Cycle Assessment quantifies the environmental impact of materials, products and whole buildings across every stage, from extraction, manufacture, transport, construction and use through to replacement and end of life, in accordance with ISO 14040/14044 and EN 15978.

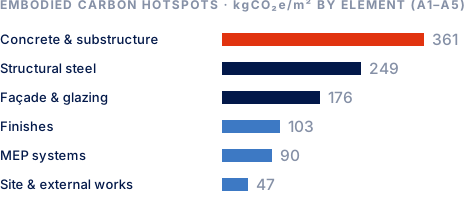
We use it to identify where impact actually concentrates, then test alternative specifications against it. In most buildings a small number of elements carry the majority of embodied carbon, and they are decided early.

Scope of service
  • Whole Building Life Cycle Assessment
  • Embodied carbon analysis
  • Material impact comparison
  • Environmental Product Declaration review
  • Building material optimization
  • Carbon hotspot identification
  • Alternative scenario assessment
  • Life-cycle impact evaluation
Fig. 12.1 · Typical distribution of embodied carbon by building element, modules A1–A5. Illustrative values for a commercial asset.
Environmental Product Declarations

An EPD is a verified, standardized statement of a product's environmental impact. We review supplier EPDs for scope, validity and comparability before they are used in an assessment. Declarations are frequently not directly comparable, and substitutions made on the headline figure alone can increase impact.

Why embodied carbon is now the harder problem
It is already spent

Operational carbon can be improved later. Embodied carbon is emitted before handover and cannot be recovered.

It is a growing share

As grids decarbonize and buildings become more efficient, materials account for a larger proportion of lifetime impact.

It is credit-bearing

LEED, BREEAM and regional systems award credits for whole-building LCA and material transparency.

It is being disclosed

Embodied carbon is increasingly reported in Scope 3 inventories and requested in investor due diligence.

Certify
Measure
Optimize
Decarbonize
D · Life Cycle Assessment & EPD 12
Service D · continued

Life cycle thinking

13
Fig. 13.1 · Whole-building life cycle stages, EN 15978 module structure
A1–A5
Product and construction stages, where most embodied carbon is fixed
B1–B7
Use stage, covering maintenance, repair and replacement
C1–C4
End of life, covering demolition, transport and disposal

A life cycle assessment is only useful if it changes a decision. We run it at the point where the structural system, the façade build-up and the primary materials are still open, and we present the result as a comparison between options, not as a single number.

Where the decisions are made
ConceptStructural system, grid, massing, basement extent. The largest single influence on embodied carbon.
SchemeFaçade build-up, glazing ratio, structural efficiency, material family selection.
DetailConcrete mix design, cement replacement, steel recycled content, finishes.
ProcurementSupplier EPDs, transport distance, local sourcing, substitution control.
Environmental and financial together

LCA quantifies the environmental impact of a specification. LCC, overleaf, quantifies its financial impact. OKELIS runs both from the same model, so that the two results can be read against each other rather than argued separately.

Deliverables
  • Whole building LCA report
  • Embodied carbon baseline
  • Hotspot analysis
  • Material option comparison
  • EPD review & register
  • Reduction recommendations
  • Certification credit evidence
  • Procurement guidance note
D · Life Cycle Assessment & EPD 13
E
Service E
Life Cycle Costing

The lowest capital cost
is rarely the lowest
whole-life cost.

14

Value engineering that only looks at capital cost transfers the saving onto the operator.

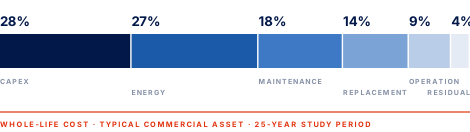
Life Cycle Cost Analysis evaluates the full financial consequence of a design decision, covering capital, energy, water, maintenance, replacement, operation and residual value, discounted to present value over a defined study period.

It gives the client an objective basis for choosing between alternatives, and gives the design team a defence for the specification that performs, expressed in the terms the decision is actually made in.

Cost components assessed
  • Initial capital cost
  • Energy cost
  • Water cost
  • Maintenance cost
  • Replacement cost
  • Operational cost
  • Residual value
  • Discounted cash flow
  • Net Present Value
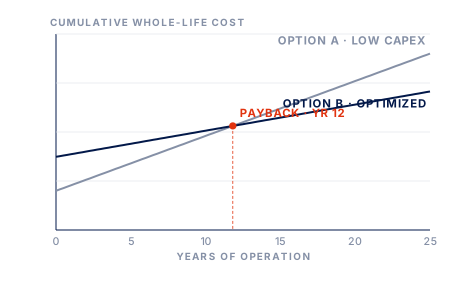
  • Payback analysis
  • Alternative design comparison
  • Sensitivity & scenario testing
Basis
ISO 15686-5NPV / discounted cash flow Defined study periodSensitivity analysis
Fig. 14.1 · Indicative whole-life cost composition. Capital cost is typically under a third of the total. Illustrative values.
Parameters that decide the answer
Study period

Set to the client's holding period or the asset's design life. A shorter period favours low capital cost.

Discount rate

The client's cost of capital. A higher rate discounts future savings and favours deferral.

Escalation

Assumed movement in energy, water and labour cost over the period, tested for sensitivity.

Component life

Expected service life and replacement cycle of each system, and the residual value at the end.

Certify
Measure
Optimize
Decarbonize
E · Life Cycle Costing 14
Service E · continued

Comparing options on whole-life cost

15
Fig. 15.1 · Cumulative whole-life cost of two design options. The higher-capital option overtakes on total cost at the payback point and remains lower for the rest of the study period. Illustrative.
01
Define the study period

Set against the client's holding period or the asset's design life, not a default. The period chosen determines which option wins.

02
Model the cash flows

Capital, energy, water, maintenance, periodic replacement and disposal, with energy demand taken from the building energy model rather than assumed.

03
Discount to present value

Apply the client's discount rate and escalation assumptions, and state them explicitly. The result is only meaningful alongside them.

04
Test the sensitivity

Vary energy tariff, discount rate and component life. An option that only wins under one set of assumptions is not a recommendation.

Typical questions we answer
  • Which façade specification gives the best whole-life return?
  • Does the higher-efficiency chiller plant pay back within the holding period?
  • What is the true cost of the value-engineered alternative?
  • Should the PV array be sized to demand or to roof area?
  • Which package delivers the certification target at lowest whole-life cost?
Deliverables
  • Life cycle cost model
  • Option comparison & NPV summary
  • Payback and discounted cash flow analysis
  • Sensitivity and scenario report
  • Recommendation with stated assumptions
The analysis exists to show what a proposed capital saving costs across the life of the asset.
E · Life Cycle Costing 15
F
Service F
Building Energy Modelling

Energy performance,
modelled hour by hour.

16

A calibrated energy model turns an argument about the façade into a number.

We build whole-building thermal models to evaluate and optimize energy performance, testing envelope, glazing, shading, HVAC strategy, lighting, controls and renewable generation against the local climate and the building's real operating profile.

The model serves several purposes at once: code and certification compliance, energy conservation measure evaluation, EUI targeting, and the energy demand that feeds the carbon inventory and the life cycle cost analysis.

Scope of service
  • Whole-building energy simulation
  • Baseline vs proposed comparison
  • HVAC energy assessment
  • Building envelope optimization
  • Lighting energy assessment
  • Renewable energy scenario analysis
  • Energy conservation measure evaluation
  • Energy code compliance
  • Certification energy modelling
  • Annual consumption & EUI analysis
Simulation tools
IES VEeQUEST ASHRAE 90.1 App. GParametric analysis
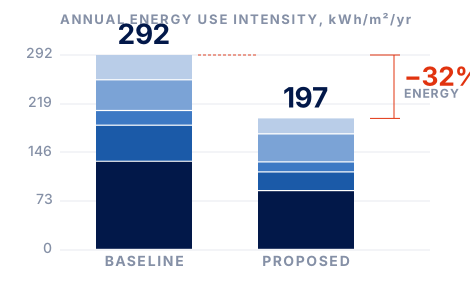
Fig. 16.1 · Baseline versus proposed annual energy use by end use. Illustrative kWh/m²/yr.
Image · Simulation output
IES VE or eQUEST model view. 3D thermal model or results screen
What the model is used for
Compliance

Demonstrating the required improvement over an ASHRAE 90.1 Appendix G or local code baseline.

Certification

Producing the energy evidence behind LEED, Estidama, Mostadam and Al Sa'fat credits.

Design decisions

Ranking envelope, glazing, shading and plant options on measured energy and cost impact.

Downstream analysis

Supplying the energy demand used in the carbon inventory and the life cycle cost model.

Certify
Measure
Optimize
Decarbonize
F · Building Energy Modelling 16
Service F · continued

Optimizing building performance

17
Building performance model
Inputs
Architecture
Envelope
HVAC
Lighting
Daylight
Renewables
Occupancy
Climate data
Energy
simulation
Outputs
Optimized building performance

Annual energy consumption · Energy Use Intensity · peak demand · end-use breakdown · compliance margin · certification points · carbon and cost inputs.

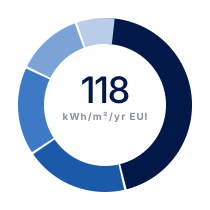
Fig. 17.1 · Modelled end-use split
Energy conservation measures we evaluate
EnvelopeInsulation levels, thermal bridging, air-tightness, glazing specification, window-to-wall ratio, external shading and orientation response.
HVACSystem selection, plant efficiency, part-load behaviour, heat recovery, demand-controlled ventilation, chilled water and district cooling interface.
LightingInstalled power density, daylight-linked dimming, occupancy control and zoning strategy.
ControlsSetpoints, schedules, optimum start, night purge, and the gap between designed and operated behaviour.
RenewablesPhotovoltaic array sizing, self-consumption, solar thermal and on-site generation scenarios.
Deliverables
  • Energy model & report
  • Baseline / proposed comparison
  • ECM evaluation matrix
  • Code compliance documentation
  • Certification energy submission
  • EUI and consumption forecast
−32%
Indicative energy reduction, optimized case
118
kWh/m²/yr modelled EUI
8760
Hours simulated per annual run
F · Building Energy Modelling 17
G
Service G
Daylighting Assessment

Daylight, glare and solar
gain assessed together.

18

In this climate, the daylight strategy and the cooling load are the same decision.

We simulate annual daylight availability across the floor plate to maximize useful natural light while controlling glare and solar gain, reducing lighting energy demand without transferring the load onto the cooling system.

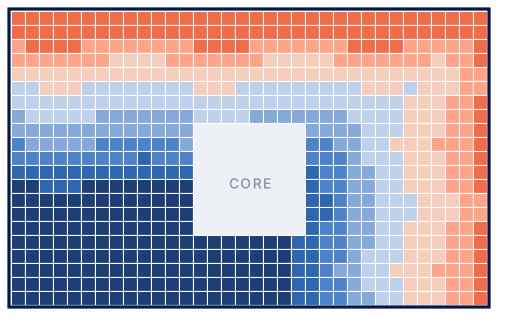
Results are expressed in the metrics that certification bodies and design teams actually use: spatial daylight autonomy, annual sunlight exposure, daylight factor and glare probability, evaluated against the façade options on the table.

Scope of service
  • Daylight simulation
  • Spatial Daylight Autonomy (sDA)
  • Annual Sunlight Exposure (ASE)
  • Daylight factor assessment
  • Glare assessment
  • Window & façade optimization
  • Shading analysis
  • Interior daylight distribution
  • Certification daylight calculations
  • Lighting energy interaction
Metrics reported
sDA 300/50%ASE 1000,250h Daylight factorDGP glare Illuminance (lux)
Fig. 18.1 · Floor-plate daylight autonomy heat map. Illustrative.
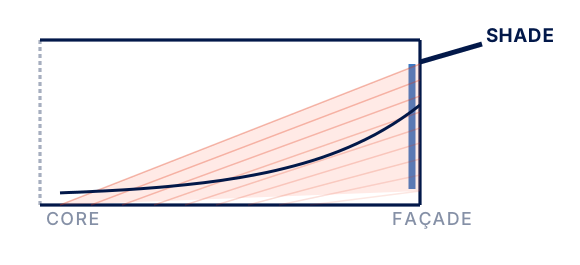
Fig. 18.2 · Section: shading device, daylight penetration and illuminance falloff.
What we simulate

Annual daylight availability across the occupied floor plate, hour by hour, against the local sky and sun path.

What we optimize

Glazing ratio, glass specification, external shading geometry and internal control strategy.

What it changes

Lighting energy, cooling load, plant sizing, occupant comfort and certification credit achievement.

Certify
Measure
Optimize
Decarbonize
G · Daylighting Assessment 18
Service G · continued

Optimizing the façade

19

Glazing ratio, glass specification and shading geometry are usually settled on appearance and capital cost, then defended for the rest of the project. We test them against daylight, glare, cooling load and lighting energy together, and present the trade-off as a set of comparable options.

The four variables
Glazing ratioMore glass admits more daylight and more heat. The useful range is narrower than most schemes assume, and it is orientation-dependent.
Glass specificationVisible light transmittance against solar heat gain coefficient. A high-performance coating can hold daylight while cutting gain.
External shadingGeometry tuned to orientation and sun path: horizontal on south, vertical on east and west. The most effective single measure in this climate.
Interior controlBlinds, light shelves and daylight-linked dimming. Necessary, but no substitute for getting the façade right.
Deliverables
  • Daylight simulation report
  • sDA and ASE compliance results
  • Floor-plate daylight heat maps
  • Glare assessment
  • Shading and façade recommendations
  • Certification credit evidence
Why it pays twice

A well-daylit floor plate reduces installed lighting hours, which reduces lighting energy and the cooling load that lighting creates. Handled badly, the same daylight arrives as glare and solar gain. Occupants close the blinds, the lights go on, and the cooling system carries both.

55%
Typical sDA target for certification credit
sDA

Spatial Daylight Autonomy. The share of floor area receiving 300 lux for at least half of occupied hours.

ASE

Annual Sunlight Exposure. The share of area receiving excessive direct sun, a proxy for glare risk.

Daylight factor

Interior illuminance as a percentage of unobstructed exterior illuminance under an overcast sky.

DGP

Daylight Glare Probability. Occupant discomfort risk evaluated from specific view positions.

G · Daylighting Assessment 19
Integrated Sustainability Approach

How the services
work on one project.

20

Each service has its own deliverable, but they are not sequential and they are not independent. The energy model feeds the carbon inventory and the cost analysis. The daylight study changes the façade, which changes both. Certification evidence is a by-product of work already done. The matrix below shows where each discipline is active across a project.

Service Concept Design Procurement Construction Operation
Green Building Certification
Building Energy Modelling
Daylighting Assessment
Life Cycle Assessment
Life Cycle Costing
GHG & Carbon Accounting
ESG Reporting & Advisory
Highest influence
Active
As required
Where the services meet
Daylight → Energy → Cost

The shading study changes the cooling load in the energy model, which changes the operating cost in the LCC and the plant size in the capital cost.

LCA → LCC → Specification

The material comparison is run for carbon and for whole-life cost together, so the substitution is judged on both before it reaches procurement.

Energy → Carbon → ESG

The modelled and metered energy demand becomes the Scope 2 inventory, which becomes the disclosed emissions intensity in the ESG report.

Integrated Approach 20
Project Lifecycle

Where the scope sits
in a project.

21

Influence over performance is highest at concept and lowest at handover, while the cost of change moves in the opposite direction. Our scope is arranged around that reality.

1
Concept
Targets, rating selection, feasibility, massing and orientation response, early carbon and cost baselines.
2
Design
Energy and daylight modelling, façade optimization, LCA, LCC, credit strategy and design-stage evidence.
3
Procurement
Specification review, EPD and submittal assessment, tender sustainability requirements.
4
Construction
Contractor coordination, site audits, record collection, compliance verification, submission.
5
Operation
Performance verification, GHG inventory, ESG reporting, recertification and continuous improvement.
ABILITY TO INFLUENCE PERFORMANCE COST OF MAKING A CHANGE CONCEPT OPERATION
Fig. 21.1 · The case for early engagement
Our position

Sustainability consultants are frequently appointed once the design is fixed, at which point the role reduces to documenting whatever the building already is.

Appointed at concept, the same fee changes the building. We would rather argue about orientation and structural grid than write a compliance report for decisions nobody can revisit.

Certify
Measure
Optimize
Decarbonize
Project Lifecycle 21
Sectors We Serve

Every sector has a
different performance
problem.

22

A hospital, a data-heavy office and a hotel do not fail in the same way. Occupancy pattern, internal gain, ventilation duty and operating hours drive completely different strategies, which is why the analysis is set up per sector rather than per template.

Residential
Envelope and thermal comfort, domestic hot water, ventilation, Estidama and Al Sa'fat compliance.
Commercial
Daylight and glare, HVAC efficiency, tenant fit-out control, LEED and investor-grade disclosure.
Hospitality
Continuous operation, high domestic hot water and laundry loads, guest comfort, water strategy.
Education
Daylight quality, ventilation and indoor air quality, intermittent occupancy, acoustic interface.
Healthcare
High ventilation duty, resilience and redundancy, stringent air quality, 24-hour energy demand.
Retail
Lighting energy, high internal gains, footfall-driven ventilation, fit-out sustainability guidelines.
Mixed-Use
Diverse load profiles, shared plant and metering strategy, multiple certification boundaries.
Infrastructure
Embodied carbon dominance, materials and earthworks, long asset life, whole-life cost focus.
Industrial
Process energy, Scope 1 combustion, heat recovery opportunity, corporate GHG inventory.
Government
Mandatory rating compliance, public reporting duty, exemplar performance requirements.
Corporate & portfolio clients

Beyond individual assets, we work with corporate and institutional organizations on portfolio-level GHG inventories, ESG reporting, decarbonization strategy and performance benchmarking across multiple buildings and operations.

Sectors We Serve 22
Standards & Frameworks

The rules we work to.

23

Our analysis is prepared against internationally and regionally recognized standards, so that results are comparable, defensible and acceptable to certification bodies, auditors, lenders and regulators.

Green building rating systems
LEED
USGBC · International green building rating system
BREEAM
BRE · International sustainability assessment method
Estidama
Pearl Rating System · Abu Dhabi, UAE
WELL
IWBI · Occupant health and wellbeing standard
Mostadam
National rating system · Kingdom of Saudi Arabia
Barjeel
Green building regulations · Ras Al Khaimah, UAE
Al Sa'fat
Dubai Green Building Regulations & Specifications
Regional codes
Emirate and municipality-level compliance requirements
Carbon, ESG & life cycle
GHG ProtocolCorporate accounting and reporting standard for Scope 1, 2 and 3 emissions
ISO 14064Quantification, reporting and verification of greenhouse gas emissions
ISO 14040 / 14044Life cycle assessment: principles, framework and requirements
EN 15978Assessment of environmental performance of buildings, calculation method
ISO 15686-5Buildings and constructed assets: life cycle costing
GRIGlobal Reporting Initiative sustainability reporting standards
TCFD · CDP · UN SDGsClimate-related disclosure, environmental scoring and global goal alignment
Energy, comfort & simulation
ASHRAE 90.1Energy standard for buildings, including Appendix G performance rating method
ASHRAE 55Thermal environmental conditions for human occupancy
ASHRAE 62.1Ventilation and acceptable indoor air quality
IES LM-83Spatial Daylight Autonomy and Annual Sunlight Exposure methodology
International energy codesApplicable national and emirate-level energy conservation requirements
CIBSE guidanceBuilding services design and performance evaluation references
Note on certification marks

Where certification body logos are used in the final published portfolio, the list and its presentation will be reviewed and confirmed against each organization's trademark and usage requirements prior to publication. For review

Standards & Frameworks 23
Projects Overview

Twenty-five projects,
one rating system.

24

Delivered in Abu Dhabi under the Estidama Pearl Rating System, in Pearl Qualified Professional and Independent Commissioning Agent roles, with the building performance analysis run in-house alongside.

Project image awaited
Red Crescent Headquarters
2 Pearl PBRS · PQP, ICA and energy modelling · Completed
25
Projects delivered under the
Estidama Pearl Rating System
18 completed · 7 ongoing
9
Delivered at 2 Pearl,
the highest rating held
2 Pearl 9 1 Pearl 13
Sector mix
Education 9 Residential 6 Commercial 3 Community 2 Mixed-use 2 Data centre 1 Healthcare 1 Hospitality 1
Engaged at design stage on 17 of 25
The point at which the analysis still changes the building.
Project image awaited
Amazon Data Center
1 Pearl PBRS · PQP and ICA · Completed
Project image awaited
Al Sader Schools 1, 2 and 3
2 Pearl PBRS · Energy modelling and waste · Ongoing
Scopes run in-house
Energy modelling19
PQP and ICA19
Waste management4
Life cycle assessment2
Daylighting, LCC1

Project photography, gross floor area and client names to be supplied by OKELIS. Client naming approval required before publication. Awaited

Projects Overview 24
Project Experience

Twenty-five projects
under Estidama.

25

All projects are located in Abu Dhabi and delivered under the Estidama Pearl Rating System, in Pearl Qualified Professional and Independent Commissioning Agent roles, together with the technical scopes carried out alongside them.

No. Project Stage OKELIS scope Target rating Status
1Red Crescent HeadquartersConstructionPQP · ICA · Energy modelling2 Pearl PBRSCompleted
2International Community SchoolConstructionPQP · ICA · Energy modelling2 Pearl PBRSCompleted
3Noya 2 Jumaa MosqueDesignPQP · ICA · Energy modelling2 Pearl PBRSCompleted
4Abu Dhabi Equine & Camel HospitalDesignPQP · ICA · Energy modelling1 Pearl PBRSCompleted
5Jamal Al Nuaimi VillaDesignPQP · ICA · Energy modelling1 Pearl PVRSCompleted
6Al Suweidi VillaDesignPQP · ICA · Energy modelling1 Pearl PVRSCompleted
7Avangard Training CenterConstructionEnergy modelling1 Pearl PBRSCompleted
8Eagle Hills Broad ProjectDesignPQP · ICA · Energy modelling1 Pearl PBRSCompleted
9Al Reman Residential Building C48DesignPQP · ICA · Energy modelling1 Pearl PBRSCompleted
10Al Reman Residential Building C73DesignPQP · ICA · Energy modelling1 Pearl PBRSCompleted
11Commercial Building C144DesignPQP · ICA · Energy modelling1 Pearl PBRSCompleted
12Commercial Building C64DesignPQP · ICA · Energy modelling1 Pearl PBRSCompleted
13Commercial Building C61DesignPQP · ICA · Energy modelling1 Pearl PBRSCompleted
14Muna AcademyConstructionDaylighting · LCCNot ratedCompleted
15Amazon Data CenterDesignPQP · ICA1 Pearl PBRSCompleted
16Al Reman Residential Building 868DesignPQP · ICA1 Pearl PBRSCompleted
17Residential Building C25DesignPQP · ICA · Energy modelling1 Pearl PBRSOngoing
18Eagle Hills Broad ProjectConstructionSupervision1 Pearl PBRSOngoing
19Delma Mall HotelConstructionEnergy modelling1 Pearl PBRSOngoing
20Al Sader 1 SchoolDesignPQP · ICA · Energy modelling · Waste2 Pearl PBRSOngoing
21Al Sader 2 SchoolDesignPQP · ICA · Energy modelling · Waste2 Pearl PBRSOngoing
22Al Sader 3 SchoolDesignPQP · ICA · Energy modelling · Waste2 Pearl PBRSOngoing
23Al Shamkha SchoolDesignPQP · ICA · Energy modelling · Waste2 Pearl PBRSOngoing
24Al Riyad School RD79ConstructionLife cycle assessment2 Pearl PBRSCompleted
25Al Riyad School RD79ConstructionLife cycle assessment2 Pearl PBRSCompleted

Energy modelling was carried out on 19 of the 25 projects, alongside daylighting, life cycle costing, life cycle assessment and construction waste management. Gross floor area, client name and project photography to be supplied by OKELIS for each entry. Awaited

Project Experience 25
Selected Projects

Case study, full-page template Placeholder content

26
Image · Project hero
Completed project photograph, or rendered view. Landscape, full column width
[ Project Name ]
[ One-line project descriptor: what it is and why it mattered ]
Location
[ City, Country ]
Building type
[ Sector ]
Area
[ 00,000 m² ]
Client
[ Client name ]
Certification
[ Rating · Target ]
Services provided
  • [ Service 1 ]
  • [ Service 2 ]
  • [ Service 3 ]
  • [ Service 4 ]
Key challenge

[ The constraint the project team was working against: a regulatory requirement, a performance target, a programme or budget pressure, a site condition. Two to three sentences. ]

OKELIS solution

[ What we analysed, what we recommended and what changed as a result. State the method used and the decision it informed. Two to three sentences. ]

Results
25%
Energy
35%
Water
40%
Operational carbon
XX tCO₂e
Avoided

Figures shown are illustrative placeholders only. Actual project data, imagery and client approvals to be provided by OKELIS before publication.

Selected Projects 26
Our Approach

How we run
an engagement.

27
STEP 01
Understand the objective

Before any modelling, we establish what the project is actually trying to achieve: a regulatory approval, an investor requirement, an operating cost target, a reputational position, or all four. The technical scope follows from that, not from a standard service list.

STEP 02
Establish the baseline

A defensible starting point: the boundary, the assumptions, the emission factors, the climate file, the operating profile. Documented and agreed at the outset, because every subsequent result is measured against it.

STEP 03
Model and test options

Simulation across the disciplines that apply, covering energy, daylight, carbon and cost, run as a set of comparable options rather than a single scheme. Where the option space is large, parametric and AI-assisted workflows widen the search.

STEP 04
Recommend, with the trade-off visible

Findings are presented as a decision, not a data dump: what we recommend, what it costs, what it delivers, what it depends on, and what the alternative would have been. Assumptions are stated so the recommendation can be challenged.

STEP 05
Carry it through delivery

Recommendations are tracked through specification, tender, submittal review and construction. A measure that is designed but not procured has delivered nothing, and this is where most performance is lost.

STEP 06
Verify in operation

Once the asset is running, measured performance is compared against the model. The gap is investigated, reported, and fed back into the next project. This is what keeps the modelling honest.

The recurring framework
Certify → Measure → Optimize → Decarbonize

Applied to a single building or an entire organization, the sequence is the same.

Certify

Establish the standard the asset will be held to.

Measure

Quantify the current and predicted performance.

Optimize

Test options and select on evidence.

Decarbonize

Deliver, verify and report the reduction.

Our Approach 27
Why Work With OKELIS

What you get that
you would not get
from four consultants.

28
For developers & asset owners
  • A certification outcome managed to award, not handed over at design stage
  • Operating cost and carbon quantified before the specification is fixed
  • A defensible sustainability position for lenders, investors and occupiers
  • One accountable party across certification, carbon, cost and comfort
For design teams & contractors
  • Simulation evidence that arrives in time to influence the design
  • Credit requirements translated into buildable, procurable specifications
  • Construction-stage support where certifications are usually lost
  • Consistent numbers across every report, covering energy, carbon, daylight and cost
One
Model behind every number

Energy, carbon, cost and daylight results all derive from the same geometry and the same assumptions, so they never contradict each other.

Seven
Integrated service lines

Certification, ESG, GHG, LCA, LCC, energy modelling and daylighting, coordinated rather than subcontracted.

25
Estidama projects delivered

Every published figure traces to a model run, a measurement or a documented emission factor, and the assumptions travel with it.

PQP + ICA
Appointments held in-house

Pearl Qualified Professional and Independent Commissioning Agent roles carried on our own projects, not subcontracted.

OKELIS is appointed to produce the analysis, documentation and certification evidence that a sustainability target requires, and to stay on the project until it is awarded.
Why Work With OKELIS 28
Contact
29
Let's discuss the performance
your project has to prove.

For enquiries regarding certification, ESG, carbon accounting, life cycle analysis or building-performance modelling, please contact us.

Office
Abu Dhabi
United Arab Emirates

[ Full registered address ]
OKELIS Engineering Consultancy L.L.C. S.P.C.

Contact
+971 55 378 3188

[ email address ]
[ website ]

Details to confirm
Certify
Measure
Optimize
Decarbonize